Performances results
The performance metrics indicate that the Eclipse model achieves exceptional predictive accuracy and robust generalization capabilities. 🚀
Training set
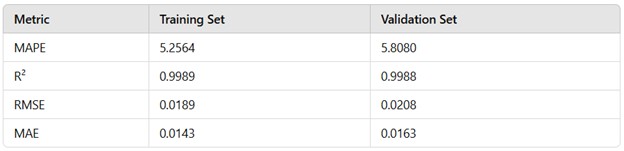
On the training set, the MAPE of 5.26% reflects that, on average, the model’s predictions deviate by 5.26% from the true values. This implies that for a target value normalized between -1 and 1, the average absolute deviation remains small, typically within the range of ±0.0526 in scaled terms.
Similarly, the R² value of 0.9989 signifies that 99.89% of the variance in the dependent variable is explained by the model, demonstrating a near-perfect fit.
The RMSE (0.0189) quantifies the average magnitude of prediction errors, with its low value indicating minimal large errors, while the MAE (0.0143) shows that, on average, the model’s absolute prediction error remains close to 0.0143 in scaled terms.
Validation set
For the validation set, the MAPE of 5.81% suggests a slightly higher average percentage error on unseen data, which translates to a mean absolute deviation of approximately ±0.0581 within the normalized range. This still reflects strong predictive capability.
The R² value of 0.9988 indicates that 99.88% of the variance in the validation data is captured, confirming the model's ability to generalize effectively.
The RMSE (0.0208) suggests that the model’s average prediction errors are slightly larger on unseen data, but still negligible in magnitude, and the MAE (0.0163) confirms consistently low absolute prediction errors.
These results imply that the model reliably predicts cyclical tops and bottoms within a small margin of error, even when applied to new data. The low MAPE ensures that deviations remain proportionally small, the high R² demonstrates the strength of the model in explaining variability, and the low RMSE and MAE indicate that predictions are precise and consistent across both training and validation sets.
This makes the Eclipse model a scientifically robust and practically reliable tool for forecasting market cycles.